Nimen Hao!!!!! (Hi, y'all.)
We had a test today; our test was all about average velocity, acceleration, position-time graph, velocity time graph…etc.oh…it’s out of 40…. i think that's what we all did for today’s class…
We have a new topic ….I’m not sure if it is Dynamic…I found some websites about dynamics …but I’m not sure if they’re related to our new lesson on Monday…..
http://www.euclideanspace.com/physics/dynamics/index.htm
http://regentsprep.org/Regents/physics/phys-topic.cfm?Course=PHYS&TopicCode=01c
JIAYOU!!!!!!!!!(Do ur best)
Showing posts with label kinematics. Show all posts
Showing posts with label kinematics. Show all posts
Thursday, November 27, 2008


Wednesday, November 26, 2008
Hi guys, it's Suzette. Today, we corrected worksheets.
1. Information in Kinematics Graphs
2. Acceleration Motion I
3. Simple Vectors
Answers: Information in Kinematics Graphs

Answers: Accelerated Motion I
1. a. 15 m/s
b. 18.75 m
2. a. 200 m/s
b. 912.5 m
3. a. 1.5 m/s/s
b. 120 m
4. 250 m
5. 11 m/s/s
Answers: Simple Vectors
1. distance - s
mass - s
time - s
area - s
force - v
displacement - v
velocity - v
acceleration - v
2.

3. a. d= 800 m
b. d= 583
angle = 50 degrees
4. a. f = 200 N
b. f = 0 N
c. f = 1414 N
Then after correcting all those sheets, we did an exercise from the book.
Problem - p. 82 -83, # 1, 5, 8, 10, 11, 16
answers:
1. a = 8.0 m/s/s
5. v2 = 33 m/s
8. a. v2 = 607 m/s
b. N = a. 1.83
10. d = 920 m
11. d = 1700 m
16. v2 = 7 m/s
NEXT SCRIBE IS KIMBERLY!
1. Information in Kinematics Graphs
2. Acceleration Motion I
3. Simple Vectors
Answers: Information in Kinematics Graphs

Answers: Accelerated Motion I
1. a. 15 m/s
b. 18.75 m
2. a. 200 m/s
b. 912.5 m
3. a. 1.5 m/s/s
b. 120 m
4. 250 m
5. 11 m/s/s
Answers: Simple Vectors
1. distance - s
mass - s
time - s
area - s
force - v
displacement - v
velocity - v
acceleration - v
2.

3. a. d= 800 m
b. d= 583
angle = 50 degrees
4. a. f = 200 N
b. f = 0 N
c. f = 1414 N
Then after correcting all those sheets, we did an exercise from the book.
Problem - p. 82 -83, # 1, 5, 8, 10, 11, 16
answers:
1. a = 8.0 m/s/s
5. v2 = 33 m/s
8. a. v2 = 607 m/s
b. N = a. 1.83
10. d = 920 m
11. d = 1700 m
16. v2 = 7 m/s
NEXT SCRIBE IS KIMBERLY!
Tuesday, November 25, 2008
Monday & Tuesday, November 24-25,2008
Today I'll be doing two blogs since I forgot to do it for monday and assign someone for Tuesday. First we corrected alot of sheets in physics, "Components of vectors", first page of Acceleration, 4.1 What is acceleration?
Components of vectors
1. b
2. b
3. c
4. b
5. d
6. a
7. c
8. c
9. b
10. c
11. c
12. c
13. c
14. c
Acceleration (first page)
1. a = V2-V1/Change of time = 25m/s-0m/s / 4s-0s = 6.3 m/s²
2. a = V2-V1/change of time = 29.28m/s-0m/s / 3s-0s = 9.8 m/s²
3. V2 = V1 + a(change of time) = 28m/s + (2.5m/s²)(3s-0s) = 36m/s
4. change of time = V2-V1 / a = 14.1m/s -0m/s / 13.2m/s² = 4.4s
5. change of velocity = a(change of time) = 56.3m/s²(1.9) = 107m/s = 110m/s with sig. digits
What is Acceleration?
The change in velocity divided by the time interval is average acceleration. It can be calculated using the equation a=v/t. In this equation a stands for acceleration, ٨V stands for change in velocity, and ٨t stands forthe time interval. If velocity is measured in metres per second, acceleration is measures in m/s/s, which is read as metres per second per second. The unit also can be written as m/s², which is read as metres per second squared. Like velocity, acceleration is a(n) vector quantity, which means it has both magnitude and direction. When velocity increases, acceleration is positive. When velocity decreases, acceleratin is negative.
Average and Instantaneous Acceleration
A velocity-time graph shows how velocity depends on time. The rise of the curve represents the change in velocity. The run of the curve represents the time interval. The slope of the curve represents the average acceleration. If the curve on a velocity-time graph is a straight line, the acceleration is constant. If the curve is not a straight line, acceleration is changing. The slope of a line tangeant to the curve is the instantaneous acceleration at that time.
Velocity of an object with constant acceleration
Acceleration that does not change in time is constant, or uniform, acceleration. The velocity when the clock time is zero is the initial velocity. The velocity after acceleration has occurred is called the final velocity, and is calculated using the equation V2=V1+at. In this equation, V2 is final velocity, V1 initial velocity, a is acceleration, and t is time interval.
Displacement when velocity and time are known
If an object is accelrating, its displacement can be calculated using the equation d=(V2+V1/2)t. In this equation, d stands for displacement, V2 stands for final velocity, V1 stands for initial velocity, and ٨t stands for time interval. To find displacement using a velocity-time graph, find the area under the curve.
Well this is all i can remember correcting over these two days, tell me if i forgot something and i'll try to find the answers to those also. Also don't forget to do the 2nd page on "Acceleration" as we will probably correct it in class tomorrow.
TOMORROW'S SCRIBE : Suzette
Components of vectors
1. b
2. b
3. c
4. b
5. d
6. a
7. c
8. c
9. b
10. c
11. c
12. c
13. c
14. c
Acceleration (first page)
1. a = V2-V1/Change of time = 25m/s-0m/s / 4s-0s = 6.3 m/s²
2. a = V2-V1/change of time = 29.28m/s-0m/s / 3s-0s = 9.8 m/s²
3. V2 = V1 + a(change of time) = 28m/s + (2.5m/s²)(3s-0s) = 36m/s
4. change of time = V2-V1 / a = 14.1m/s -0m/s / 13.2m/s² = 4.4s
5. change of velocity = a(change of time) = 56.3m/s²(1.9) = 107m/s = 110m/s with sig. digits
What is Acceleration?
The change in velocity divided by the time interval is average acceleration. It can be calculated using the equation a=v/t. In this equation a stands for acceleration, ٨V stands for change in velocity, and ٨t stands forthe time interval. If velocity is measured in metres per second, acceleration is measures in m/s/s, which is read as metres per second per second. The unit also can be written as m/s², which is read as metres per second squared. Like velocity, acceleration is a(n) vector quantity, which means it has both magnitude and direction. When velocity increases, acceleration is positive. When velocity decreases, acceleratin is negative.
Average and Instantaneous Acceleration
A velocity-time graph shows how velocity depends on time. The rise of the curve represents the change in velocity. The run of the curve represents the time interval. The slope of the curve represents the average acceleration. If the curve on a velocity-time graph is a straight line, the acceleration is constant. If the curve is not a straight line, acceleration is changing. The slope of a line tangeant to the curve is the instantaneous acceleration at that time.
Velocity of an object with constant acceleration
Acceleration that does not change in time is constant, or uniform, acceleration. The velocity when the clock time is zero is the initial velocity. The velocity after acceleration has occurred is called the final velocity, and is calculated using the equation V2=V1+at. In this equation, V2 is final velocity, V1 initial velocity, a is acceleration, and t is time interval.
Displacement when velocity and time are known
If an object is accelrating, its displacement can be calculated using the equation d=(V2+V1/2)t. In this equation, d stands for displacement, V2 stands for final velocity, V1 stands for initial velocity, and ٨t stands for time interval. To find displacement using a velocity-time graph, find the area under the curve.
Well this is all i can remember correcting over these two days, tell me if i forgot something and i'll try to find the answers to those also. Also don't forget to do the 2nd page on "Acceleration" as we will probably correct it in class tomorrow.
TOMORROW'S SCRIBE : Suzette
Sunday, November 23, 2008
Friday's class
Friday, november 21/2008
In class we had a subtitute. I dont quite remember what her name was, but anyways..In class we were given a few things to do.
1.) Read 6.1 & 6.2 (p.110- 119)
Graphical and Analytical Vector addition
2.)End of chap Q's: p.129 #1-7 (6.1 Q's)
-> (fig 6-25 p.128)
-> 4 for #2, 5 & 6
im pretty sure thats all we did, no homework because we couldn't take the book home, so yeah if i missed anything else , tell me and ill fix it.
By the way this is erica maquimot scribing for last friday instead of aldrin.
And the next scribe is : anthony lee .
In class we had a subtitute. I dont quite remember what her name was, but anyways..In class we were given a few things to do.
1.) Read 6.1 & 6.2 (p.110- 119)
Graphical and Analytical Vector addition
2.)End of chap Q's: p.129 #1-7 (6.1 Q's)
-> (fig 6-25 p.128)
-> 4 for #2, 5 & 6
im pretty sure thats all we did, no homework because we couldn't take the book home, so yeah if i missed anything else , tell me and ill fix it.
By the way this is erica maquimot scribing for last friday instead of aldrin.
And the next scribe is : anthony lee .
Thursday, November 20, 2008
HEEY GUYS!!
today in physics class ms.kozoriz "section 5.1: graphing motion in one dimension" and "section 4.1: properties of vectors". Here are the answers
Section 5.1: Graphing Motion in One Dimension
Segment v a - 0.25km/min
v b - 0
v c - 0.4km/min
Δt a - 10min
Δt b - 7min
Δt c - 13min
Δd a - 2.5km
Δd b - o
Δd c - 5.2km
Table Two
Δt = 30min
distance ran = 7.7 km
displacement = 17.7
average velocity = 0.26 km/min
Section 4.1: Properties of Vectors
Ms. Kozoriz also taught us something about adding vectors. Here it is if you guys missed it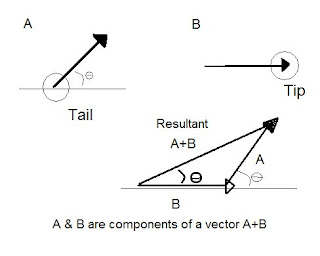
And for the people that was away, dont forget to hand in the "appendix 3.8: inter pretending position time graph which was due today. and we also received 3 sheets called "section 4.2: components of vectors, Simple Vectors, and a crossword puzzle. so dont forget to pick those up.
THE NEXT SCRIBE : ALDRIN SAYUNO
Section 5.1: Graphing Motion in One Dimension
- Position(y-axis) Time(x-axis)
- At the same position
- Objects at rest
- Not a finite period of time
- 0's
- A
- D
- B
- B
- D
- C
- arrows going to the right that are the same distance apart
- two dots separated from each other
- arrows going to the left that are the same distance apart
- False (4 quantities)
- True
- False (d represents the the position at any time)
- True
- True
Segment v a - 0.25km/min
v b - 0
v c - 0.4km/min
Δt a - 10min
Δt b - 7min
Δt c - 13min
Δd a - 2.5km
Δd b - o
Δd c - 5.2km
Table Two
Δt = 30min
distance ran = 7.7 km
displacement = 17.7
average velocity = 0.26 km/min
Section 4.1: Properties of Vectors
- 6km (E)
- 6km (N)
- 6km (NW)
- 4km (N)
- 3km (W)
- 5km (SE)
- 4m (SW)
- 12km (E)
- 20m (SE)
- 400m (W)
- b) d=2.0 km north
- d) d=2.0 km
- H,F,B
- B,F,G,I
- B,F
- True
- False (protractor)
- False (tail)
- True
- False
Ms. Kozoriz also taught us something about adding vectors. Here it is if you guys missed it

And for the people that was away, dont forget to hand in the "appendix 3.8: inter pretending position time graph which was due today. and we also received 3 sheets called "section 4.2: components of vectors, Simple Vectors, and a crossword puzzle. so dont forget to pick those up.
THE NEXT SCRIBE : ALDRIN SAYUNO
Wednesday, November 19, 2008
November 19, 2008
Kinematics!
Today in class, we had a substitute filling in for Ms. Kozoriz and corrected the chapter 3 study guide. I'll post the answers up just in case anyone missed any blanks.
Position and Distance
An object's position can be described in terms of its relationship to a reference point. Choosing a reference point establishes a(n) frame of reference. Describing distance does not need a(n) frame reference. Distance involves only a measurement of length, and is a(n) scalar quantity. Position involves both distance and direction, and is a(n) vector quantity.
Average Velocity
If an object is moving, its position at one and only one time is a(n) instantaneous position. The change is position of an object is its displacement, which is a(n) vector quantity. The average velocity of an object is the change in position divide by the time interval over which the change occurred. Average velocity is calculated using the equation v=Δd/ Δt. In this equation Δd, which is read as "delta d", stands for displacement. the symbol Δt, which is read as "delta t", stands for time interval. Average velocity is expressed in a unit made up of a(n) distance unit divided by a(n) time unit. Different units used to describe average velocity can be change can be changed from one to another by the use of conversion factors.
Finding Displacement from Velocity and Time
Displacement can be caculated by using the equation Δd= v Δt. In this equation, v represents average velocity and Δt represents the time intercal. if the average velocity of an object is the same at all time intervals, the object is described as moving at constant, or uniform, velocity. Constant velocity can be calculated using the equation v=d/t.
Position-Time Graphs
A position-time graph is used to show how position depends on time. If the motion is constant, the data produced a(n) straight line, which means the relationship between time and position is linear.
The Slope of a Position-Time Graph
On a position-time graph, the displacement is the vertical separation of two points. The time interval is the horizontal separation. the slop of the ratio of the rise to the run. The rise of the line represents displacement. The run of the line represents the time interval. the slope of the line represents the velocity of the object.
Positive and Negative Velocities
Displacements can be positive or negative, but time interval are always positive. Displacements to the right or the reference point are positive. Displacements to the left of the reference point are negative. Speed is the magnitude of velocity. Speed is generally shown as positive, but velocity can be positive or negative.
Instantaneous Velocity
If motion is not constant, the position-time grpah does not produce a(n) straight line. A straight line can be drawn tangent to the curve at any one point. The slope of this line is the instantanrous velocity at that point.
Velocity-Time Graphs
In a velocity-time graph, time is shown on the horizontal axis and velocity is shown on the vertical axis. If velocity is constant, the velocity-time graph produces a(n) straight line that is parallel to the horizontal axis. If velocity is incresing, the line has a(n) positive slope. If velocity is decreasing, the line has a(n) negative slope. The vertical value of any point on the line is the instaneous velocity at that time. The area under the line on a velocity-time graph is equal to the displacement of the object from its orignal position to its position at a given time.
Relativity of Velocity
Measurements of position of velocity depend on the observer's frame of reference. If a person walks slowly toward the back of a moving train, an observer on the train would say that the velocity and displacement are negative. A observer standing on the station platform would say that the walkers velocity and displacement are positive. Howerever, when velocities approach the speed of light, the frame of reference does not matter, and the velocity is the same, This concept is part of Einstein's theory of relativity.
We were also given time to do other worksheets (chapter 4 study guide and section 4.1: properties of vectors)
Kinematics!
Today in class, we had a substitute filling in for Ms. Kozoriz and corrected the chapter 3 study guide. I'll post the answers up just in case anyone missed any blanks.
Position and Distance
An object's position can be described in terms of its relationship to a reference point. Choosing a reference point establishes a(n) frame of reference. Describing distance does not need a(n) frame reference. Distance involves only a measurement of length, and is a(n) scalar quantity. Position involves both distance and direction, and is a(n) vector quantity.
Average Velocity
If an object is moving, its position at one and only one time is a(n) instantaneous position. The change is position of an object is its displacement, which is a(n) vector quantity. The average velocity of an object is the change in position divide by the time interval over which the change occurred. Average velocity is calculated using the equation v=Δd/ Δt. In this equation Δd, which is read as "delta d", stands for displacement. the symbol Δt, which is read as "delta t", stands for time interval. Average velocity is expressed in a unit made up of a(n) distance unit divided by a(n) time unit. Different units used to describe average velocity can be change can be changed from one to another by the use of conversion factors.
Finding Displacement from Velocity and Time
Displacement can be caculated by using the equation Δd= v Δt. In this equation, v represents average velocity and Δt represents the time intercal. if the average velocity of an object is the same at all time intervals, the object is described as moving at constant, or uniform, velocity. Constant velocity can be calculated using the equation v=d/t.
Position-Time Graphs
A position-time graph is used to show how position depends on time. If the motion is constant, the data produced a(n) straight line, which means the relationship between time and position is linear.
The Slope of a Position-Time Graph
On a position-time graph, the displacement is the vertical separation of two points. The time interval is the horizontal separation. the slop of the ratio of the rise to the run. The rise of the line represents displacement. The run of the line represents the time interval. the slope of the line represents the velocity of the object.
Positive and Negative Velocities
Displacements can be positive or negative, but time interval are always positive. Displacements to the right or the reference point are positive. Displacements to the left of the reference point are negative. Speed is the magnitude of velocity. Speed is generally shown as positive, but velocity can be positive or negative.
Instantaneous Velocity
If motion is not constant, the position-time grpah does not produce a(n) straight line. A straight line can be drawn tangent to the curve at any one point. The slope of this line is the instantanrous velocity at that point.
Velocity-Time Graphs
In a velocity-time graph, time is shown on the horizontal axis and velocity is shown on the vertical axis. If velocity is constant, the velocity-time graph produces a(n) straight line that is parallel to the horizontal axis. If velocity is incresing, the line has a(n) positive slope. If velocity is decreasing, the line has a(n) negative slope. The vertical value of any point on the line is the instaneous velocity at that time. The area under the line on a velocity-time graph is equal to the displacement of the object from its orignal position to its position at a given time.
Relativity of Velocity
Measurements of position of velocity depend on the observer's frame of reference. If a person walks slowly toward the back of a moving train, an observer on the train would say that the velocity and displacement are negative. A observer standing on the station platform would say that the walkers velocity and displacement are positive. Howerever, when velocities approach the speed of light, the frame of reference does not matter, and the velocity is the same, This concept is part of Einstein's theory of relativity.
We were also given time to do other worksheets (chapter 4 study guide and section 4.1: properties of vectors)
Tuesday, November 18, 2008
Kinematics
Hello !
Today in class we did quite a bunch of things. One of which was correcting Appendix 3.6: Describing Motion in Various Ways
Appendix 3.6: Describing Motion in Various Ways:
I'm pretty sure that people made some minor mistakes because of the "ohhh!" reactions and "that's how it is!" responses after Mrs. K told us the answers. I think the tricky part of the whole thing was the l ast two questions. (Question 4 letters e and f)
e) What is the total displacement for the student's journey? Find this from the graph.
I'm pretty sure most of got the right numeric answer (5m) but must of us missed the minor things that makes all the difference. First of all, this one needs a direction [south] and since it's going in the southerly direction, it is negative. Therefore you can either put your answer in the form 5m [south] OR -5m to show the negative.
f) What is the average velocity for the whole journey?
Average velocity can be calculated using the formula v = d/t
The tricky part of this question is the same as the last question. Basically the possible minor errors that can occur can lose you a mark!
answer: .1 m/s [s] OR -.1 m/s
--
Aside from correcting the worksheet, Mrs. Kozoriz left us with other work to do. Those are all for homework (Position-Time Graphs, Chapter 3 Study Guide and Study Guide 5.1 Graphing Motion in One Dimension)
OUR NEXT SCRIBE IS:: LYNEL POBRE!
Subscribe to:
Posts (Atom)
